
 Landsat-7
Level-0 and Level-1 Data Sets Document
Landsat-7
Level-0 and Level-1 Data Sets Document
The launch of the Landsat-7 satellite on April 15, 1999, marks the addition of the latest satellite to the Landsat satellite series. The Earth Resources Technology Satellite (ERTS) Program launched the first of a series of satellites (ERTS 1) in 1972. Part of the National Aeronautics and Space Administration's (NASA) Earth Resources Survey Program, the ERTS Program and the ERTS satellites were later renamed Landsat to better represent the civil satellite program's prime emphasis on remote sensing of land resources. Landsats 1, 2, and 3 carried the multispectral scanner (MSS) sensor and experimental return beam vidicon cameras. The Landsat-4 satellite carried the MSS and thematic mapper (TM) sensors as does the still currently flying Landsat-5 satellite. The sixth satellite in the Landsat series was unsuccessfully launched and did not achieve orbit. The Landsat-7 satellite carries the enhanced thematic mapper plus (ETM+) sensor. The launch of the Landsat-7 satellite is part of an ongoing mission to provide quality remote sensing data in support of research and applications activities.
Thank you to the National Oceanic and Atmospheric Administration (NOAA), NOAA/National Environmental Satellite, Data, and Information Service, and to NASA for their roles in the cooperative effort to prepare this document.
Landsat-7 data are collected from a nominal altitude of 705 kilometers in a near-polar, near-circular, Sun-synchronous orbit at an inclination of 98.2 degrees, imaging the same 183-km swath of the Earth's surface every 16 days.
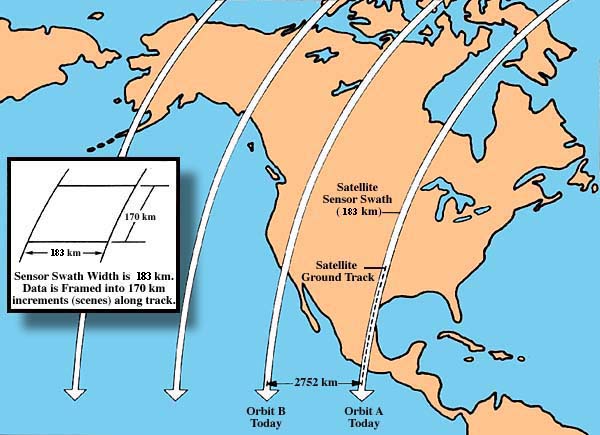
The orbital pattern equates to a 233-orbit cycle with a swath sidelap that varies from approximately 7 percent at the Equator to nearly 84 percent at 81 degrees north or south latitude.
| IMAGE SIDELAP OF ADJACENT SWATHS | |
|---|---|
| Latitude (degrees) | Image Sidelap (percent) |
| 0 | 7.3 |
| 10 | 8.7 |
| 20 | 12.9 |
| 30 | 19.7 |
| 40 | 29.0 |
| 50 | 40.4 |
| 60 | 53.6 |
| 70 | 68.3 |
| 80 | 83.9 |
The equatorial crossing times for the Landsat-7 satellite are the same as for the Landsat-4 and Landsat-5 satellites (i.e., the Sun-synchronous orbit of the Landsat satellites implies that each pass over local latitudes takes place at approximately the same local-solar time each day).
The Landsat-7 satellite is to share its orbit configuration with NASA's Earth Observing System (EOS) Terra satellite (launch pending). Plans are for the two satellites to be placed in identical orbits, ideally 15 minutes apart from each other, with the Terra satellite in a follow-on orbit to the Landsat-7 satellite. The end result is repetitive data coverage, while such variables as plant physiology are under nearly identical conditions.
The Landsat scenes are mapped to a global notation system called the Worldwide Reference System (WRS), annotating the nominal scene center of Landsat imagery using Path and Row designators that equate to the satellite's 233-orbit cycle. Following is a portion of a WRS path/row map showing scene coverage over Cleveland, Ohio:
The Landsat-7 satellite's payload includes the ETM+ sensor. The ETM+ sensor is an enhanced version of the TM sensor flown aboard the Landsat-4 and -5 satellites, but most closely approximates the ETM sensor lost on board the Landsat-6 satellite. Sensor enhancements include the addition of the panchromatic band and two gain ranges, improved spatial resolution for the thermal band, and the addition of two solar calibrators.
The ETM+ sensor is designed to collect, filter, and detect radiation from the Earth in a 183-kilometer swath as it passes overhead, providing the necessary cross-track scanning motion while the Landsat-7 spacecraft's orbital motion provides an along-track scan. Daytime data are collected during the satellite's descending mode, while nighttime data are collected during the satellite's ascending mode.
Spectral bandwidths for the ETM+ sensor are determined through the combined response of all the system's optical path mirrors (e.g., primary, secondary, scan line corrector), spectral filters, and individual detectors. The spectral filters, located immediately in front of each detector array, predominately establish the optical bandpass for each spectral band. The filter housing for the prime focal plane contains filters for bands 1 through 4 and for band 8 (the panchromatic band). The filter housing for the cold focal plane assembly contains filters for bands 5 through 7. Following is a comparison of bandwidths between the TM sensor flown aboard the Landsat-4 and -5 satellites and the ETM+ sensor flown aboard the Landsat-7 satellite:
| TM AND ETM+ SPECTRAL BANDWIDTHS | ||||||||
|---|---|---|---|---|---|---|---|---|
| Bandwidth (µ) Full Width - Half Maximum | Sensor | Band 1 | Band 2 | Band 3 | Band 4 | Band 5 | Band 6 | Band 7 | Band 8 |
| TM | 0.45 - 0.52 | 0.52 - 0.60 | 0.63 - 0.69 | 0.76 - 0.90 | 1.55 - 1.75 | 10.4 - 12.5 | 2.08 - 2.35 | N/A |
| ETM+ | 0.45 - 0.52 | 0.53 - 0.61 | 0.63 - 0.69 | 0.78 - 0.90 | 1.55 - 1.75 | 10.4 - 12.5 | 2.09 - 2.35 | .52 - .90 |
A discrete spectral shift that occurred with the Landsat-5 TM sensor has been attributed largely to filter outgassing. Steps have been taken to make the ETM+ sensor more resistant to this phenomenon. In addition, filters on the ETM+ sensor have shown significant improvement in band-edge responses as compared to the filters in the TM sensor flown aboard the Landsat-4 and -5 satellites.
| Parameter | Value |
| Launch Date: | April 15, 1999 |
| Orbit: | Sun Synchronous, Near Polar |
| Nominal Altitude: | 705 Kilometers, Near Circular |
| Inclination: | 98.2 Degrees |
| Nodal Period: | 98.8 Minutes |
| Equatorial Crossing Time: | 10:00 a.m., Local (Descending) |
Portion of Landsat-7 Level-0R scene. (152 kb)
When a Landsat-7 level-0R product is radiometrically corrected, it is referred to as a level-1R product (i.e., level-1 data). Radiometric correction is performed either by using gains computed on the fly by the internal calibrator or by using gains available in the calibration parameter file. No geometric corrections are applied to the level-1 data so the geometry of the level-1R product is the same as for the level-0R product (i.e., raw or level-0 Landsat-7 ETM+ sensor data).
Portion of Landsat-7 Level-1R scene. (157 kb)
When a Landsat-7 level-0R product is both radiometrically and geometrically (i.e., systematically) corrected, it is referred to as a level-1G product (i.e., still level-1 data). Correction algorithms model the spacecraft and the sensor, using data generated by onboard computers during imaging events. During processing, level-0 image data undergo two-dimensional resampling according to user-specified parameters, including output map projection, rotation angle, pixel size, and resampling kernel. Seven map projections are supported, including: (1) Universal Transverse Mercator, (2) Lambert Conformal Conic, (3) Transverse Mercator, (4) Polyconic, (5) Oblique Mercator, (6) Polar Stereographic, and (7) Space Oblique Mercator. A level-1G product is a geometrically rectified product that is free from distortions related to the satellite platform (e.g., attitude deviations from nominal), the sensor (e.g., jitter, view-angle effects), and global Earth characteristics (e.g., rotation, curvature). Distortions due to the Earth's terrain are still present.
The systematic level-1G correction process does not employ ground control or relief models to attain absolute geodetic accuracy. Residual error in the systematic level-1G product is appoximately 250 meters (1 sigma) in flat areas at sea level. Precision correction employs ground control points to reduce geodetic error of the output product to approximately 30 meters. This accuracy is attainable in areas where relief is moderate. Terrain correction processing that employs both ground control points and digital elevation models can further reduce the geodetic error of the output product to less than 30 meters in areas where terrain relief is substational.
Portion of Landsat-7 Level-1G scene. (176 kb)
| LANDSAT SATELLITES 1-7 | System | Launch (End of Service) | Sensors | Resolution (meters) | Communications | Alt. Km | R Days | D Mbps |
|---|---|---|---|---|---|---|---|
| Landsat 1 | 07/23/72 (01/06/78) | RBV MSS | 80 80 | Direct downlink with recorders | 917 | 18 | 15 |
| Landsat 2 | 01/22/75 (02/25/82) | RBV MSS | 80 80 | Direct downlink with recorders | 917 | 18 | 15 |
| Landsat 3 | 03/05/78 (03/31/83) | RBV MSS | 40 80 | Direct downlink with recorders | 917 | 18 | 15 |
| Landsat 4* | 07/16/82 | MSS TM | 80 30 | Direct downlink TDRSS | 705 | 16 | 85 |
| Landsat 5 | 03/01/84 | MSS TM | 80 30 | Direct downlink TDRSS** | 705 | 16 | 85 |
| Landsat 6 | 10/05/93 (10/05/93) | ETM | 15 (pan) 30 | Direct downlink with recorders | 705 | 16 | 85 |
| Landsat 7 | 04/15/99 | ETM+ | 15 (pan) 30 60 | Direct downlink with recorders (solid state) | 705 | 16 | 150 |
Whether as part of the primary collection effort or as part of a follow-on project, there are a variety of complementary Landsat-related data sets. Some of these data sets are listed below:
| COMPLEMENTARY DATA SETS | |
|---|---|
| NASA EDC DAAC Data Sets* | Documentation: |
| Global Land Cover Test Sites Data (Landsats 1-5) | Guide |
| NASA Landsat Data Collection (Landsats 1-5) | Guide |
| North American Landscape Characterization Data (Landsats 1-5) | Guide |
| USGS Data Sets** | Documentation: |
| Landsat Multispectral Scanner Data (Landsats 1-5) | Guide |
| LGSOWG Multispectral Scanner Data (Landsats 1-5) | Guide |
| Landsat Thematic Mapper Data (Landsats 4-5) | Guide |
| LGSOWG Thematic Mapper Data (Landsats 4-5) | Guide |
| *EDC DAAC Data Inventories Search Engine | EOS Data Gateway |
| **USGS Data Inventories Search Engine | GLIS |
As part of NASA's EOS project, the science mission of the Landsat-7 project is targeting regional and global assessments of land cover dynamics. The Landsat-7 satellite is scheduled to systematically acquire imagery from across the globe, using a Long-term Acquisition Plan. The Plan is designed to insure coverage of full seasonal and interannual changes in planetary vegetation patterns, also addressing the issue of cloud cover.
Following are examples of research projects using Landsat data:
The Landsat-7 system is designed to measure reflected radiation; data that, in turn, are used to deduce surface conditions and materials. For any given material, the amount of emitted and reflected radiation varies by wavelength. Therefore, substances or classes of ground cover may be identified and separated by their spectral signatures as shown in the figure below.
There is a direct correlation between objects and their relative reflectances. For example, the reflected radiation from healthy green growing vegetation may be highly visible in one wavelength or spectral band while the same reflected radiation may be barely visible, if visible at all, in another wavelength or spectral band. Thus, in principle, various surface materials may be recognized and distinguished from each other through differences in relative reflectances, provided there is some suitable method for measuring these differences as a function both of wavelength and of intensity of returned radiation (as a fraction or percent of the amount of the irradiating radiation).
The four surface materials shown in the following figure (GL representing grasslands, PW representing pinewoods, RS representing red sand, and SW representing silty water) may be characterized as distinct.
Each of the materials has been plotted according to its percent of reflectance for two wavelengths or spectral bands. When more than two wavelengths are involved, the plots in multi-dimensional space tend to increase the separability among different materials. This spectral separation is the basis for the multispectral remote sensing employed by the ETM+ sensor flown aboard the Landsat-7 satellite.
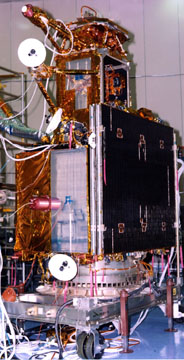
Landsat-7 spacecraft.
The Landsat-7 satellite is designed to fly a 705-kilometer, Sun-synchronous, Earth mapping orbit with a 16-day repeat cycle. Its payload is a single nadir-pointing instrument, the ETM+ sensor. Communications are provided through the satellite's S-band and X-band. The S-band is used for command and housekeeping telemetry operations while the X-Band is used for instrument data downlink. A 378-gigabit solid state recorder can hold 42 minutes of instrument data and 29 hours of housekeeping telemetry, concurrently. Power is provided by a single Sun-tracking solar array and two 50-amp-hour, nickel-hydrogen batteries. Attitude control is provided through four reaction wheels (pitch, yaw, roll, and skew), three 2-channel gyros with celestial drift updating, a static Earth sensor, a 1750A processor, and torque rods and magnetometers for momentum unloading. Orbit control and backup momentum unloading is provided through a blow-down monopropellant hydrazine system with a single tank containing 270 pounds of hydrazine, associated plumbing, and twelve 1-pound-thrust jets.
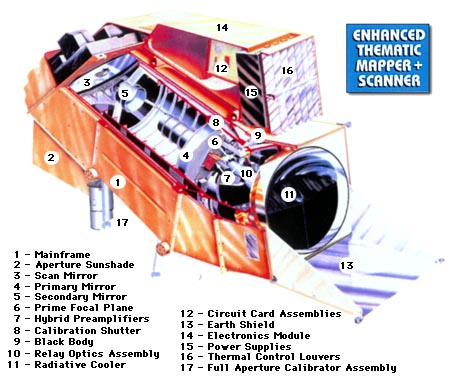
Diagram of Landsat-7 satellite components.
Satellite subassemblies include:
The structural subassemblies accommodate seven functional subsystems, including the command and data handling subsystem, the attitude control subsystem, the reaction control subsystem, the electrical power subsystem, the thermal control subsystem, the communication subsystem, and the ETM+ payload.
Energy reflected from the Earth's surface passes through several ETM+ subsystems before being collected by the solid-state detectors at the focal plane.
A bidirectional scan mirror assembly sweeps the detector's line of sight in the across-track directions. A Ritchey-Chretien telescope focuses the energy onto a pair of motion-compensation mirrors (i.e., a scan line corrector) where the energy is redirected to the focal planes. The scan line corrector is required, because there is significant overlap and underlap in ground coverage between successive scans due to the compounded effect of along-track and cross-track motion.
The then aligned energy encounters the primary focal plane, where the silicon detectors for bands 1 through 4 and band 8 are located. A portion of that energy is redirected by relay optics from the primary focal plane to the cold focal plane, where the detectors for bands 5 through 7 are located. The temperature of the cold focal plane is regulated by a radiative cooler. The spectral filters for the bands are located directly in front of their respective detectors.
The second source, a 122-centimeter source (SIS48), is equipped with six 200-watt lamps, two 100-watt lamps, and four 25-watt lamps. The SIS48 was used for monitoring the radiometric calibration of the ETM+ sensor five times during instrument- and spacecraft-level testing. During SIS calibrations, the bench test cooler was used to maintain the temperature of the cold focal plane at 105 degrees. This was the only one of the three temperature set points for the cold focal plane that could be obtained under ambient pressure and temperature conditions.
The calibration data reduction is performed as follows:
(1) ETM+ band spectral radiances (Ll,b,s), for band "b", and sphere level "s", are calculated as:
The slopes of these regression lines are the responsivities or gains, (G(d,b), and the intercepts are the biases, B(d,b). The Landsat Project Science Office is reviewing the various integrating sphere calibrations and their effective transfer to the ETM+ sensor before deciding which calibration should be provided to the IAS to populate the pre-launch IAS data base.
The pre-launch calibration of band 6 is primarily a calibration of this model. The radiometric calibration of the thermal band occurs during thermal vacuum testing. During this test, the ETM+ sensor is aligned to the thematic mapper calibrator (TMC), a collimator with selectable sources at its focus. During the band-6 calibration, blackbody sources are used in the TMC. The band-6 detectors' responses to combinations of various TMC blackbody and instrument temperatures are used to calibrate the instrument and to refine emitted radiance contributions from various internal ETM+ components. The results of this calibration are nominal gains and biases for band 6 and the emissivity-adjusted view factors (a(j)) for the various internal components of the ETM+ sensor that affect the band-6 calibration. The gains and biases are included in the calibration parameter file as pre-launch values for band 6.
Internal Calibrator. The IC consists of a shutter flag, two tungsten lamps, and a blackbody source. When the ETM+ sensor is operating, the IC's shutter flag oscillates in synchronization with the sensor's scan mirror. The size of the shutter flag and its speed of movement combine to provide obscuration of the light to each detector for about 8.2 milliseconds or 750 pixels for the 30-meter channels. The light pulse for the reflective bands has a width of approximately 40 pixels. For band 6, the calibration signal is similar with the blackbody pulse being about 20 pixels wide.
Full Aperture Solar Calibrator. Sensor image data acquired with the FAC appear to be an essentially flat field with vignetted cross-track edges. The image increases in brightness in the along-track direction as the solar zenith angle on the panel decreases. Specifications require the FAC to fill the ETM+ sensor's aperture for the central 1,000 pixels (approximately 1/6 of each scan line). The design nominally fills the aperture for approximately the central 50 percent of the scan line. As the mirror scans, the view angles to the FAC panel change. If the nadir-viewing pixel has the nominal 23.5-degree view angle and a 0-degree view azimuth angle, then at the extreme ends of the scan, the view zenith angle increases by about 1 degree and the view azimuth angle varies by about ±30 degrees. Pre-launch measurements of the bidirectional reflectance distribution function indicate that the radiance change across the scan should be a 1-percent effect across the full scan, assuming the aperture is filled. Across the central 1,000 pixels, this translates into a 0.1-percent effect.
Partial Aperture Solar Calibrator. The PAC is used for calibrating bands 1 through 5, 7, and 8 and consists of a small passive device that allows the ETM+ sensor to image the Sun while viewing the darker Earth. Measurements of the alignment between the PAC and the scanner assembly have revealed a design misalignment, which resulted in a nominal declination angle of the PAC (relative to satellite nadir) of 20 degrees versus the prescribed 18 degrees. This increase in declination effectively forces the satellite to acquire scenes earlier in its orbit (i.e., closer to satellite sunrise). Although the satellite's solar panel undergoes a period of thermal instability during sunrise, an analysis of the resultant jitter has shown minimal impact (< 1 percent) to the acquisition of PAC data.
The PAC generates a reduced-resolution image of the Sun, because the resolution is limited by diffraction from the small apertures. Within a PAC-processed image, it is anticipated that most uniform portions of the Sun's center will be approximately 200 pixels in width for bands 1 through 5 and for band 7, 105 pixels for band 6, and 410 pixels for band 8. Calibration is performed once a day, every day, on an orbit specified by the IAS.
Geometric characterizations include:
Geometric calibrations include:
Techniques for measuring and estimating improved values for individual detector locations and delays are being researched and may be added as a post-launch capability.
Geometric Calibration: Post-Checkout Calibrations. After the initial checkout period, ongoing calibration activities include monitoring the stability of the sensor system's geometric performance and attempting to identify and characterize systematic variations in the system's geometric parameters. Sensor alignment calibration is designed to improve in-flight knowledge of the relationship between the sensor and satellite navigation. The IAS is required to estimate sensor alignment to 24-arc-second accuracy (per axis) at least once per calendar quarter. In performing periodic checks, it may be determined that alignment knowledge has changed enough to warrant generating an updated sensor alignment matrix for inclusion in the calibration parameter file.
The behavior of the ETM+ sensor's scan mirror is measured and calibrated as necessary, using the IAS scan mirror calibration capability. The calibration process includes comparing a terrain-corrected image to a high-accuracy reference image that is constructed from a higher resolution source in order to detect systematic deviations in scan mirror motion from its nominal profile. Significant deviations are put in the calibration parameter file as updates to the scan mirror's profile polynomial coefficients. Scan mirror calibration applies to both along- and across-scan directions in order to detect and compensate for scan line corrector deviations as well. In practice, scan line corrector deviations are indistinguishable from scan mirror deviations so scan line corrector deviations are modeled as part of scan mirror motion. Distortion from many scans are analyzed to detect systematic deviations from the pre-launch forward and reverse scan mirror profiles.

| LANDSAT-7 ETM+ BAND CHARACTERISTICS | |||||
|---|---|---|---|---|---|
| Band Number |
Spectral Range (µ) | Ground Resolution (m) |
Data Lines Per Scan | Data Line Length (bytes) | Bits Per Sample |
| 1 | .450 to .515 | 30 | 16 | 6,600 | 8 |
| 2 | .525 to .605 | 30 | 16 | 6,600 | 8 |
| 3 | .630 to .690 | 30 | 16 | 6,600 | 8 |
| 4 | .775 to .900 | 30 | 16 | 6,600 | 8 |
| 5 | 1.550 to 1.750 | 30 | 16 | 6,600 | 8 |
| 6* | 10.40 to 12.50 | 60 | 8 | 3,300 | 8 |
| 7 | 2.090 to 2.35 | 30 | 16 | 6,600 | 8 |
| 8 | .520 to .900 | 15 | 32 | 13,200 | 8 |
*Values apply to both high- and low-gain data.
The Landsat-7 satellite's collection criteria are based upon the LTAP's acquisition strategy, including:
A priority of the LTAP is to document change. For example, areas with a history of significant change are assigned many acquisitions (see areas in red on temporal coverage map) while areas with a history of lesser change are assigned fewer acquisitions (see areas in blue on temporal coverage map). Areas of high latitude also are assigned fewer acquisitions, because of Sun-angle constraints.
Examples of priorities that may override LTAP specifications include natural disasters, issues of national security, and specific user requests.
Internal calibrator data, format 1. Internal lamp and shutter data are collected in order by scan line for bands 1 through 5 while blackbody radiance and shutter data are collected for band 6 (low gain). Data are collected in band sequential format once per scan and are collected in descending detector order for the 30-meter bands.
Internal calibrator data, format 2. Internal lamp and shutter data are collected in order by scan line for bands 7 and 8 while blackbody radiance and shutter data are collected for band 6 (high gain). Data are collected in band sequential format once per scan and are collected in descending detector order for the 30-meter bands.
Calibration parameters. The IAS regularly updates the calibration parameter file, because of changing radiometric and geometric parameters required for level-1 processing. These calibration parameters are included with level-0 products.
Mirror scan correction data, MSCD format 1. An MSCD logical record consists of three data values as they apply to the immediately preceding scan line. The three data values include scan error for the first half of the data scan, scan error for the second half of the data scan, and the direction of the scan line. This information is used to compute deviations from nominal scan mirror profiles as measured on the ground and reported in the calibration parameter file. An MSCD file also includes scan-based values such as time code, gain status, and processing errors as encountered by the Landsat Processing System (LPS). The MSCD files are modified by product with an extra file added during the subsetting process, because of the file's correspondence to the previous scan.
Mirror scan correction data, MSCD format 2. A duplicate set of MSCD values are generated during format-2 processing in the event that format-1 data are lost or corrupted.
Payload correction data, PCD format 1. A PCD file includes attitude and ephemeris profiles and high-frequency jitter measurements. The information in a PCD file is distributed in subinterval increments no matter what the coverage of individual products.
Payload correction data, PCD format 2. A duplicate set of PCD values are generated during format-2 processing in the event that format-1 data are lost or corrupted.
Scan line offsets, format 1. During LPS processing, image data are shifted in an extended buffer to account for predetermined detector and band shifts, scan line length, and possible bumper wear. The scan line offsets represent actual starting and ending pixel positions for valid or nonzero-filled image data on a data-line-by-data-line basis for bands 1 through 5 and for band 6 at low gain. The left-starting pixel offsets apply to both image data and internal calibration data, while the right-hand offsets for image data and for internal calibration data differ and are reported separately.
Scan line offsets, format 2. As with format-1 image data, format-2 image data are shifted in an extended buffer to account for predetermined detector and band shifts, scan line length, and possible bumper wear. The scan line offsets represent actual starting and ending pixel positions for valid or nonzero-filled image data on a data-line-by-data-line basis for band 6 at high gain and for bands 7 and 8. The left-starting pixel offsets apply to both image data and internal calibration data, while the right-hand offsets for image data and for internal calibration data differ and are reported separately.
Metadata, format 1. During LPS processing, metadata are generated for each subinterval's spatial extent, content, and data quality for bands 1 through 5 and for band 6 at low gain. These metadata are distributed in their original form and in their entirety.
Metadata, format 2. During LPS processing, metadata are generated for each subinterval's spatial extent, content, and data quality for band 6 at high gain and for bands 7 and 8. Format-2 metadata do not include cloud cover assessments or references to browse data. These metadata are distributed in their original form and in their entirety.
Metadata, ECS. During order processing, ECS generates a third metadata file. This file contains product-specific information such as corner coordinates and the number of scans.
Geolocation index. This ECS-generated table contains scene corner coordinates and product-specific scan line numbers for bands 1 through 8, covering all three band resolutions.
HDF directory. The directory contains the pointers, file-size information, and data objects required to open and process level-0 products, using the HDF library and interface routines. Every level-0 product includes two PCD files, two MSCD files, three metadata files, the calibration parameter file, and the HDF directory. Counts for internal calibrator, scan line offset, and image files are affected when products contain less than the full complement of bands.
Worldwide Reference System (WRS) Scene. Landsat-7 ETM+ sensor data are framed into approximately 183-kilometer by 170-kilometer increments or scenes. The nominal centers for the Landsat-7 scenes map to the WRS reference system used for Landsat-4 and -5 data. Therefore, the scenes are referred to as WRS scenes.
Interval. An interval is described as the duration of time between the start and the end of an imaging operation or land observation by the ETM+ sensor. The raw wideband data collected during an interval consist of a contiguous set of WRS scenes not to exceed the length of 90 scenes.
Subinterval. In general, a subinterval is a segment of an interval. Subintervals are the result of breaks in the wideband data stream. These breaks may be due to communication dropouts, due to the inability of the Landsat-7 spacecraft to transmit a complete observation or interval within a single contact period, or due to both of these circumstances. The smallest subinterval equates to a partial EMT+ scene, which also may be referred to as a subscene, while the largest subinterval may not exceed the length of 35 WRS scenes.
Partial Subinterval. A partial subinterval is a segment of a subinterval, no less than the length of one WRS scene and no more than the length of 35 WRS scenes, the maximum length of a subinterval. A partial subinterval may be positioned at the starting point of any scan line and may be defined by either contiguous WRS locations or by rectangular latitude and longitude bounding coordinates. In the latter case, all scan lines touched by the bounding rectangle are included in their entirety.
Currently, data are distributed at the single WRS-scene granule level. Distribution of subintervals and partial subintervals is pending.
Landsat-7 level-0 product HDF data structures include:
Level-0 files and external elements may vary by product size. The files accompanying each full-band, dual-format, level-0 product include: the HDF directory (containing the pointers, file-size information, and data objects required to open and process level-0 products, using the HDF library and interface routines), two payload correction data files (format 1 and format 2), two mirror scan correction data files (format 1 and format 2), three metadata files (format 1, format 2, and ECS specific), a calibration parameter file, and a geolocation index.
Data may be represented in both binary and American Standard Code for Information Interchange (ASCII) formats. Bit and byte ordering follow conventions set by the Institute of Electrical and Electronics Engineers with the term "byte" being synonymous with octet as used by the International Organization for Standardization.
More HDF information may be viewed at the HDFinfo Web site.
File Naming Convention. Level 0. Except for the calibration parameter file, level-0 HDF data structure names are derived as follows:
where
This is the normal mapping of the numerical value of the capture source in the configuration table. For files received on tape from Alaska or Norway, the current value of the string is used unless specified otherwise.
f indicates ETM+ data format.
n indicates an LPS processor number (1-9).
YY indicates the last two digits of the year associated with a contact period (not acquisition time).
DOY indicates the Julian date for the contact period.
HH indicates the hour of the contact period within a 24-hour day (00-23).
uu indicates a subinterval number within this contact period (01-99).
v indicates the data set version number (v = 0 for original data or 1-9 for reprocessed data).
xxx indicates the type of data (MSD for mirror scan correction data, PCD for payload correction data, GEO for the geolocation index, B10 through B83 for the image data, C10 through C80 for the internal calibration data, and O10 through O83 for the scan line offsets. The LPS uses the B81, B82, and B83 extensions for band 8 when multiple files are required for storage. The HDF data structure name starts with B81 even if band 8 is extracted from the second (B82) or the third (B83) LPS band-8 file. Similar naming conventions are used when naming scan-line-offset data objects.
DOY indicates Julian date for product creation.
xxxx indicates unique ECS 4-digit identifier.
Calibration parameters are stored as ASCII text using an object data language syntax developed by the Jet Propulsion Laboratory. The naming convention for the calibration parameter file is derived from the file name assigned by the IAS and is annotated as follows:
where
File Naming Convention. Except for the calibration parameter file, level-1 HDF data structure names are derived as follows:
where
rrr_rrr indicates the starting and ending rows of the product.
YYYYMMDD indicates the acquisition date of an image.
AAA indicates the file type:
xxx indicates the product type (L1R or L1G).
Calibration parameters are stored as ASCII text using an object data language syntax developed by the Jet Propulsion Laboratory. The naming convention for the calibration parameter file is derived from the file name assigned by the IAS and is annotated as follows:
where
A separate header file exists for each of the following band groups:
Each image file contains one ETM+ band of image pixels. There are no header records, prefix data, or suffix data in the image records. Image data are unblocked, and image files are 8-bit unsigned integers.
File Naming Convention. The file naming convention for FAST-L7A is as follows:
where
rrr_rrr indicates the starting and ending rows of the product.
YYYYMMDD indicates the acquisition date of an image.
AAA indicates the file type:
FST indicates the FAST-L7A file extension.
Each band of Landsat-7 data in the GeoTIFF format is delivered as a grayscale, uncompressed, 8-bit string of unsigned integers. No other files accompany the product.
File Naming Convention. The file naming convention for GeoTIFF is as follows:
where
rrr_rrr indicates the starting and ending rows of the product.
YYYYMMDD indicates the acquisition date of an image.
AAA indicates the file type:
TIF indicates the GeoTIFF file extension.
For more information on level-1 file formats, refer to the "Earth Science Data and Information System (ESDIS) Level 1 Product Output Files Data Format Control Book, Volume 5, Book 2, Revision 2," dated November 1998 (see References).
Radiometric processing for Landsat-7 data differs in several ways from the previous Landsat systems. The first difference is the existence of an offline system responsible for generating calibration parameters and for evaluating data quality. The second difference is the ability to characterize and correct for various radiometric artifacts in the data prior to calibration. The third difference is the capability to rely on data acquired outside of the current scene being processed to perform the calibration, due in part to the addition of the new calibration hardware and due in part to a change in philosophy.
The figure below illustrates the overall flow in the radiometric processing of a level-1R product (i.e., the radiometrically, but not geometrically corrected product). The process is divided into five elements:
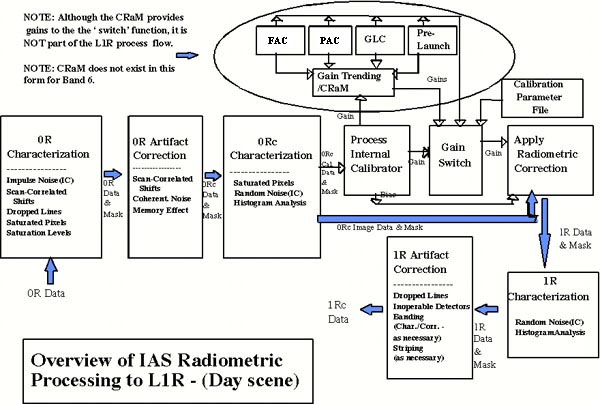
The 0R data product, which consists of uncalibrated image data, internal calibration data, payload correction data, and metadata, is ingested by the IAS. On ingest, instrument status data, including times and temperatures, are extracted from the payload correction data for the scene to be processed and for surrounding scenes in the data collection interval. These temperature data are checked for outliers and fitted versus time to provide values for the scans in the scene being processed.
At 0R characterization, the internal calibration data are checked for impulse noise detector by detector, using an along-scan median filter. Scan-correlated shifts are located (i.e., bias changes occurring in all detectors simultaneously between scans as observed on Landsat-4 and -5 TM sensor data). Fill data that were inserted at locations where data were lost in transmission are located, and pixels at the bounds of the analog-to-digital (A/D) converter are flagged (i.e., normally, pixels with 0 or 255 values ). The locations of the impulse noise in the calibrator data, the filled data, and saturated pixels are placed in a mask that becomes associated with the data throughout level-1R processing. The mask contains the location and the type of artifact found in the data (e.g., dropped lines, impulse noise, A/D saturation, analog saturation).
Histograms of the data are checked for evidence of saturation of the A/D converter at other than the nominal 0 and 255 values. The results of the characterizations are reported and stored in a data base for trending and evaluation.
The 0R data continue to the artifact-correction stage. At this stage, the image data are merged in time sequence with the internal calibrator data to reconstruct the data as originally generated by the instrument. Depending upon the presence and magnitude of the artifacts in the ETM+ sensor data, up to three corrections are performed. First, the scan-correlated shifts are removed by adding the bias into the scans where the shift occurred. And second, coherent noise is filtered out by either notch filtering or time-domain addition of an oscillating signal to the data. The TM sensor did not exhibit sufficiently well-behaved coherent noise (i.e., stability in frequency or phase) to remove coherent noise by the additive method. In the process of performing these corrections, the mask is used to ignore data that are filled, saturated, or noisy from determining the correction factors. After the corrections are applied, the data are referred to as 0Rc. The calibration and image data are separated for the next stage of processing.
The 0Rc data undergo additional radiometric characterization. If it is determined that the analog portion of the ETM+ sensor's signal chain saturated before the A/D converter, pixels exhibiting this saturation are found and flagged in the labeled mask. An analysis of the dark region of the shutter is performed to characterize the noise present and its randomness. The noise results are reported and trended. This serves as a portion of the check for detector operability. Histograms of the 0Rc data are analyzed on a detector-by-detector basis to provide relative gains between the detectors in a band. These gains are reported and trended and can be used in the correction process to adjust the gains applied during application of the radiometric calibration.
At this point, the 0Rc calibration data proceed to the process internal calibrator. Within the process internal calibrator, gains and biases are generated on a detector-by-detector basis. The process internal calibrator also checks for dead detectors. These gains are passed along in the flow and are sent to a data base where they are trended, fitted, and eventually combined with the results from other calibrators using a combined radiometric correction model (CRaM).
Prior to starting radiometric processing, a switch is set that determines which gain is to be applied to the image. Choices include: (1) the gain calculated from the internal calibrator using the scene, (2) the gain values in the current calibration parameter file, (3) the current output of the CRaM, and (4) the current trended values of the gains from any calibrator, including FAC, PAC, ground look, IC (either lamp), and the pre-launch calibration parameter file. Part of the gain switch also includes whether or not a relative gain correction is applied to the data, using the relative gains from histogram analysis or a trended data base value. The gain values are then applied to the image data and calibration data to convert the data to real radiance values. The output at this stage is level 1R.
The level-1R product is characterized, using histogram analysis for residual striping, and the random-noise analysis is repeated. If the product proceeds to geometric processing, missing data and data that are dead or inoperable (severely degraded) are filled in or left alone. Whether the data are filled in or left alone depends upon how a flag is set. Based upon:
A destriping algorithm, a debanding algorithm, or both algorithms may be performed to cosmetically improve the data if deemed necessary.
Level 1. Geometric Processing. Pending.
Short, N.M., Sr., 1998, The remote sensing tutorial--an online handbook: [Greenbelt, Maryland], Goddard Space Flight Center, electronic version, http://rst.gsfc.nasa.gov/TofC/Coverpage.html
Landsat Processing System Document Server at:
http://lps-server.gsfc.nasa.gov
Earth Science Data and Information System (ESDIS) Level-1 Product Generation System (LPGS) Document Server at:
http://lpgs-server.gsfc.nasa.gov/!LPGS_Baseline/baseline.html